
Monitor gRPC Microservices in Kubernetes with Amazon X-Ray
Microservice architecture is typically useful to solve certain scaling problems where service decoupling/segregation is required to improve development velocity, make service more fault tolerant or handle performance hotspots.
However, everything comes with a price and so does microservice. One typical issue is:
While this is half joking, monitoring and fault resilency are definitely more challenging in microservice world. While there are frameworks like Hystrix and resilience4j to handle circuit breaking, rate limiting and stuff like that, this post focuses on the first thing: how the heck are my services talking to each other?
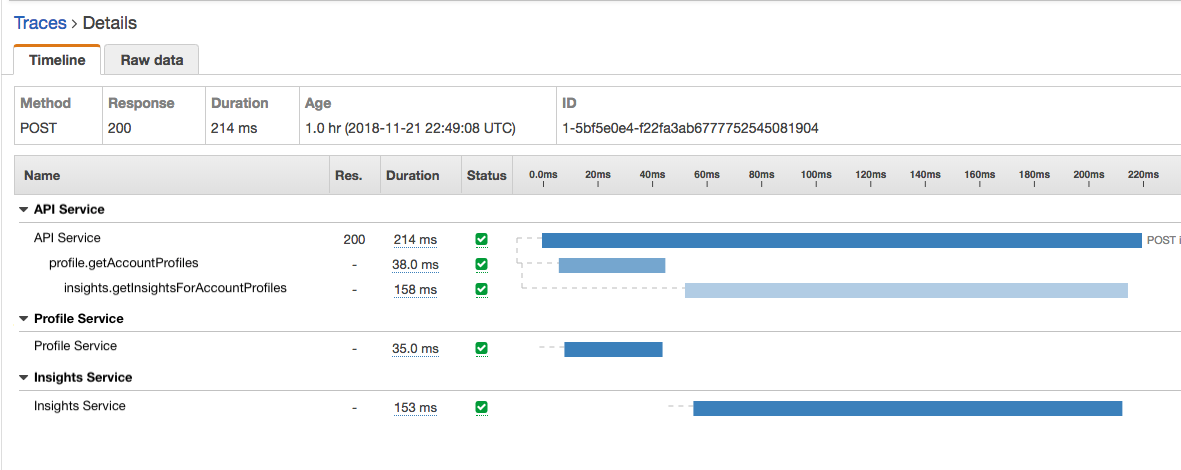
AWS X-Ray can fill the gap here by offering service mapping and tracing and thus you can see something like
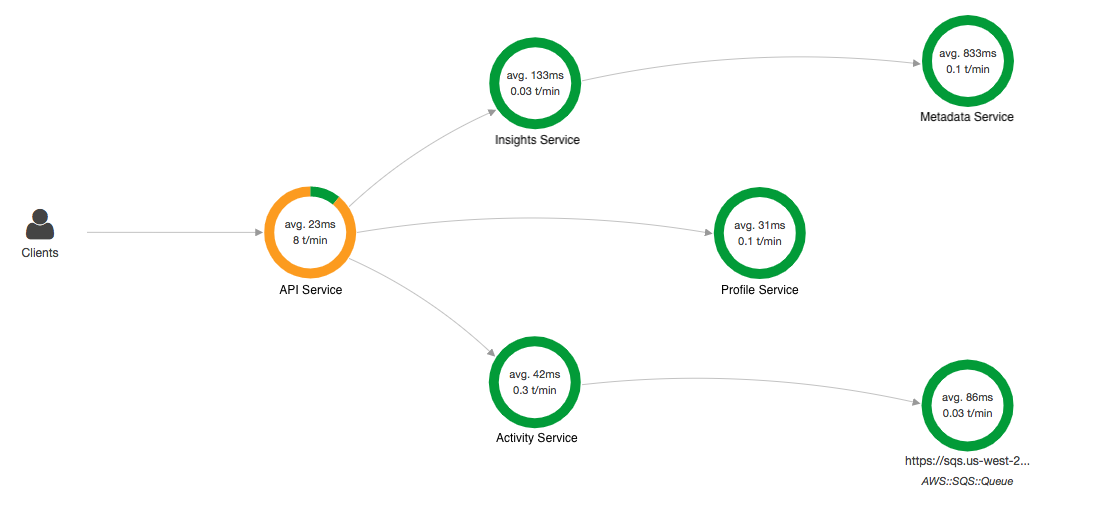
Compared to generic service monitoring,
X-Ray has some additional benefits around AWS ecosystem in that
it will auto expose your AWS resource write
(yes only write unfortunately) call insights when you use AWS SDK.
This applies to SQS, SNS and DynamoDB.
But first of all, you need to understand how X-Ray works:
- X-Ray requires application to forward insights to the daemon.
In EC2, this means the daemon process alongside with your application.
In Kubenetes, this means you’d need to install it as a daemonset so it would run with your node. - When a request enters the first service (typically an API gateway),
the service is responsible for creating the firstsegmentand generate thetrace ID
(typically created by AWS X-Ray SDK).
Asegmentrepresents the overall lifecycle of a request within one application,
identified bysegment ID.
Atrace IDidentifies the overall roundtrip of a request across multiple applications. - A service, when making requests to other services,
should generate correspondingsubsegments.
Asubsegmentis used to identify activities within one application.
This is not required for service mapping but nice to have for tracing purposes. - A service, when accepting traffic from other services,
should relay the trace ID and the previous segment ID (called parent ID in SDK).
This is such that the service mapping can be generated.
For inter-service communication, gRPC is often used. Compared to JSON over REST, gRPC offers more flexibility around query design and better performance thanks to the efficiency of (de)serialization with protobuf and the usage of http2 multiplexing. The extra typing and backward compatibility from protobuf also help documentation and maintenance, improving the overall quality of service quorum.
However, while X-Ray SDK offers J2EE servlet filter for general http servers, gRPC does not follow that. The canonical gRPC Java implementation uses netty and has no knowledge around that.
This means we’d have to write some custom code. Unfortunately the documentation around that is next to none. Luckily, gRPC has implicit support via io.grpc.ServerInterceptor and io.grpc.ClientInterceptor so it’s just a matter of how to wire pieces together.
Overall there are 4 steps:
- Set up Kubernetes daemonset
- Grant permission to Kubernetes nodes so they can write metrics to X-Ray.
- Write/use interceptors in code
- Route metrics to X-Ray daemon
Let’s do this step by step:
Set up Kubernetes daemonset
There’s an example offered by Amazon regarding how to install it: link
Grant permission to Kubernetes nodes
This is a bit tricky depending how your kube cluster is set up.
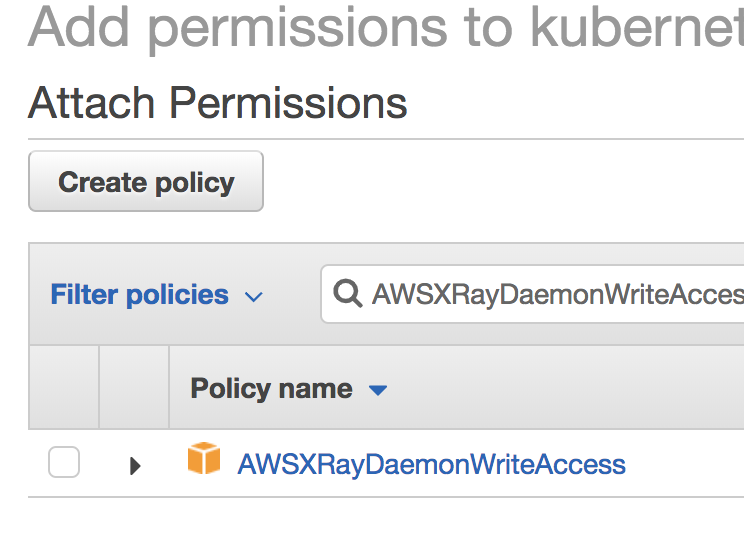
If you use EKS/EC2, you need to grant X-Ray write permission by
attaching the canned policy to your IAM role for the worker nodes.
If you host your kubenetes outside AWS ecosystem,
well chances are you don’t need X-Ray but something generic like Istio’s sidecar approach.
But if you do need it then you can create IAM users,
attach the policy and use these users in your code.
Write/use interceptors in code
First, we need to make sure we use the same language between server and client.
In typical HTTP this is the headers.
In gRPC this is the metadata, keyed by Key.
1 | public class Keys { |
Now, let’s implement client interceptor.
First you need some X-Ray stuff in classpath
(assuming Gradle is used for dependence managmement, should be similar for maven/ivy/sbt):
1 | dependencies { |
Note for demonstration purpose the verion is omitted here,
for actual usage you should peg the latest version at the time.
If you want X-Ray to instrument your AWS resource calls, you also need:
1 | compile("com.amazonaws:aws-xray-recorder-sdk-aws-sdk-instrumentor") |
Now the code:
1 | public class XRayClientInterceptor implements ClientInterceptor { |
There’s quite a lot of code here but the key gotchas are:
- You should always use an existing segment if one exists,
which is whatgetCurrentSegmentOptional()is for.
Fail to do so would result in the loss of previous segment.
If in some other code the previous segment is still referenced,
you will get missing context exceptions when trying to close it. - Always bear in mind that data streaming/async handling is baked in gRPC design.
So never close the segment directly after starting forwarding the client call.
Instead, implementClientCallListenerand let gRPC tell you when
it actually starts/finishes it. AWSXRayRecorderis thread safe so using one for all calls should be fine.
However, all the segments are tracked viaThreadLocalSegmentContextby default.
That is shared by all instances across the entire app by default
even if you have multipleAWSXRayRecorderinstances.
What that implies is you should
always remember the corresponding context for that segment/subsegment,
especially when crossing threads. Failure to do so would result in weird errors.
This is whatgetTraceEntity()andsetTraceEntity()are for.- The
put()calls would append if key with the same name already exists.
So remember to clean it up first.
The trace ID meta doesn’t need to be cleared because
it’s supposed to be the same as mentioned.
After that, wire it up when you build the client:
1 | newBlockingStub(channel).withInterceptors(new XRayClientInterceptor()); |
Next, let’s build the server side interceptor:
This has some extra flavors in that it assumes you use a spring based
gRPC server like the LogNet Springboot one.
The GRpcGlobalInterceptor would tell the runner to inject the interceptor automagically.
If that’s not the case, that’s fine,
just replace the appName with some other logic,
and wire up the interceptor using ServerInterceptors.intercept(serviceDefinition, interceptors).
1 |
|
Route metrics to X-Ray daemon
Last but not least, we need to tell X-Ray SDK to forward them to our daemon:
1 | spec: |
The value corresponds to your daemon name.
AWS_XRAY_DAEMON_ADDRESS will be read by AWS SDK at runtime.
Done
And that’s it. Just deploy the apps to kube cluster.
Bear in mind that the service map is bound to time range.
It won’t show up until you get traffic across your apps.
And if you have traffic split like A/B testing or service
migration, you’ll see how things evolve over time,
which is pretty cool.